idl_emcee
idl_emcee - IDL/GDL Library for affine-invariant MCMC Hammer

Description
idl_emcee is an Interactive Data Language (IDL)/GNU Data Language (GDL) implementation of the affine-invariant Markov chain Monte Carlo (MCMC) ensemble sampler, based on sl_emcee by M. A. Nowak, an S-Lang/ISIS implementation of the MCMC Hammer proposed by Goodman & Weare (2010), and then implemented in Python (emcee) by Foreman-Mackey et al. (2013).
Installation
- To get this package, you can simply use git command as follows:
git clone --recursive https://github.com/mcfit/idl_emcee.git
- This package does not include any dependent packages in the current version.
Installation in IDL
- To install the idl_emcee IDL library in the Interactive Data Language (IDL), you need to add the path of this package directory to your IDL path. For more information about the path management in IDL, read the tips for customizing IDL program path provided by Harris Geospatial Solutions or the IDL library installation note by David Fanning in the Coyote IDL Library.
- This package requires IDL version 7.1 or later.
Installation in GDL
You can install the GNU Data Language (GDL) if you do not have it on your machine:
- Linux (Fedora):
sudo dnf install gdl
- Linux (Ubuntu):
sudo apt-get install gnudatalanguage
- OS X (brew):
brew tap brewsci/science
brew install gnudatalanguage
- OS X (macports):
sudo port selfupdate
sudo port upgrade libtool
sudo port install gnudatalanguage
- Windows: You can use the GNU Data Language for Win32 (Unofficial Version) or you can compile the GitHub source using Visual Studio 2015 as shown in appveyor.yml.
To install the idl_emcee library in GDL, you need to add the path of this package directory to your .gdl_startup file in your home directory:
!PATH=!PATH + ':/home/idl_emcee/pro/'
You may also need to set GDL_STARTUP if you have not done in .bashrc (bash):
export GDL_STARTUP=~/.gdl_startup
or in .tcshrc (cshrc):
setenv GDL_STARTUP ~/.gdl_startup
This package requires GDL version 0.9.9 or later.
How to Use
The Documentation of the IDL functions provides in detail in the API Documentation (mcfit.github.io/idl_emcee/doc). This IDL library creates the MCMC sampling for given upper and lower uncertainties, and propagates uncertainties of parameters into the function.
See Jupyter Notebook: Notebook.ipynb
Run Jupyter Notebook on Binder:
You need to define your function. For example:
function myfunc1, input
  result1 = total(input)
  result2 = input[1]^input[0]
  return, [result1, result2]
end
and use the appropriate confidence level and uncertainty distribution. For example, for a 1.645-sigma standard deviation with a uniform distribution:
clevel=.9; 1.645-sigma
use_gaussian=0 ; uniform distribution from min value to max value
for a 1-sigma standard deviation with a Gaussian distribution:
clevel=0.68268949 ; 1.0-sigma
use_gaussian=1 ; gaussian distribution from min value to max value
and specify the number of walkers and the number of iterations:
walk_num=30
iteration_num=100
Now you provide the given upper and lower uncertainties of the input parameters:
input=[1. , 2.]
input_err=[0.2, 0.5]
input_err_p=input_err
input_err_m=-input_err
output=myfunc1(input)
temp=size(output,/DIMENSIONS)
output_num=temp[0]
You can create the MCMC sample and propagate the uncertainties of the input parameters into your defined functions as follows:
mcmc_sim=emcee_hammer('myfunc1', input, input_err_m, $
                      input_err_p, output, walk_num, $
                      iteration_num, use_gaussian)
To determine the upper and lower errors of the function outputs, you need to run:
output_error=emcee_find_errors(output, mcmc_sim, clevel, do_plot=1)
Alternatively, you could load the emcee object class as follows:
mc=obj_new('emcee')
mcmc_sim=mc->hammer('myfunc1', input, input_err_m, $
                    input_err_p, output, walk_num=walk_num, $
                    iteration_num=iteration_num, $
                    use_gaussian=use_gaussian)
output_error=mc->find_errors(output, mcmc_sim, clevel=clevel, do_plot=1)
which shows the following distribution histograms:
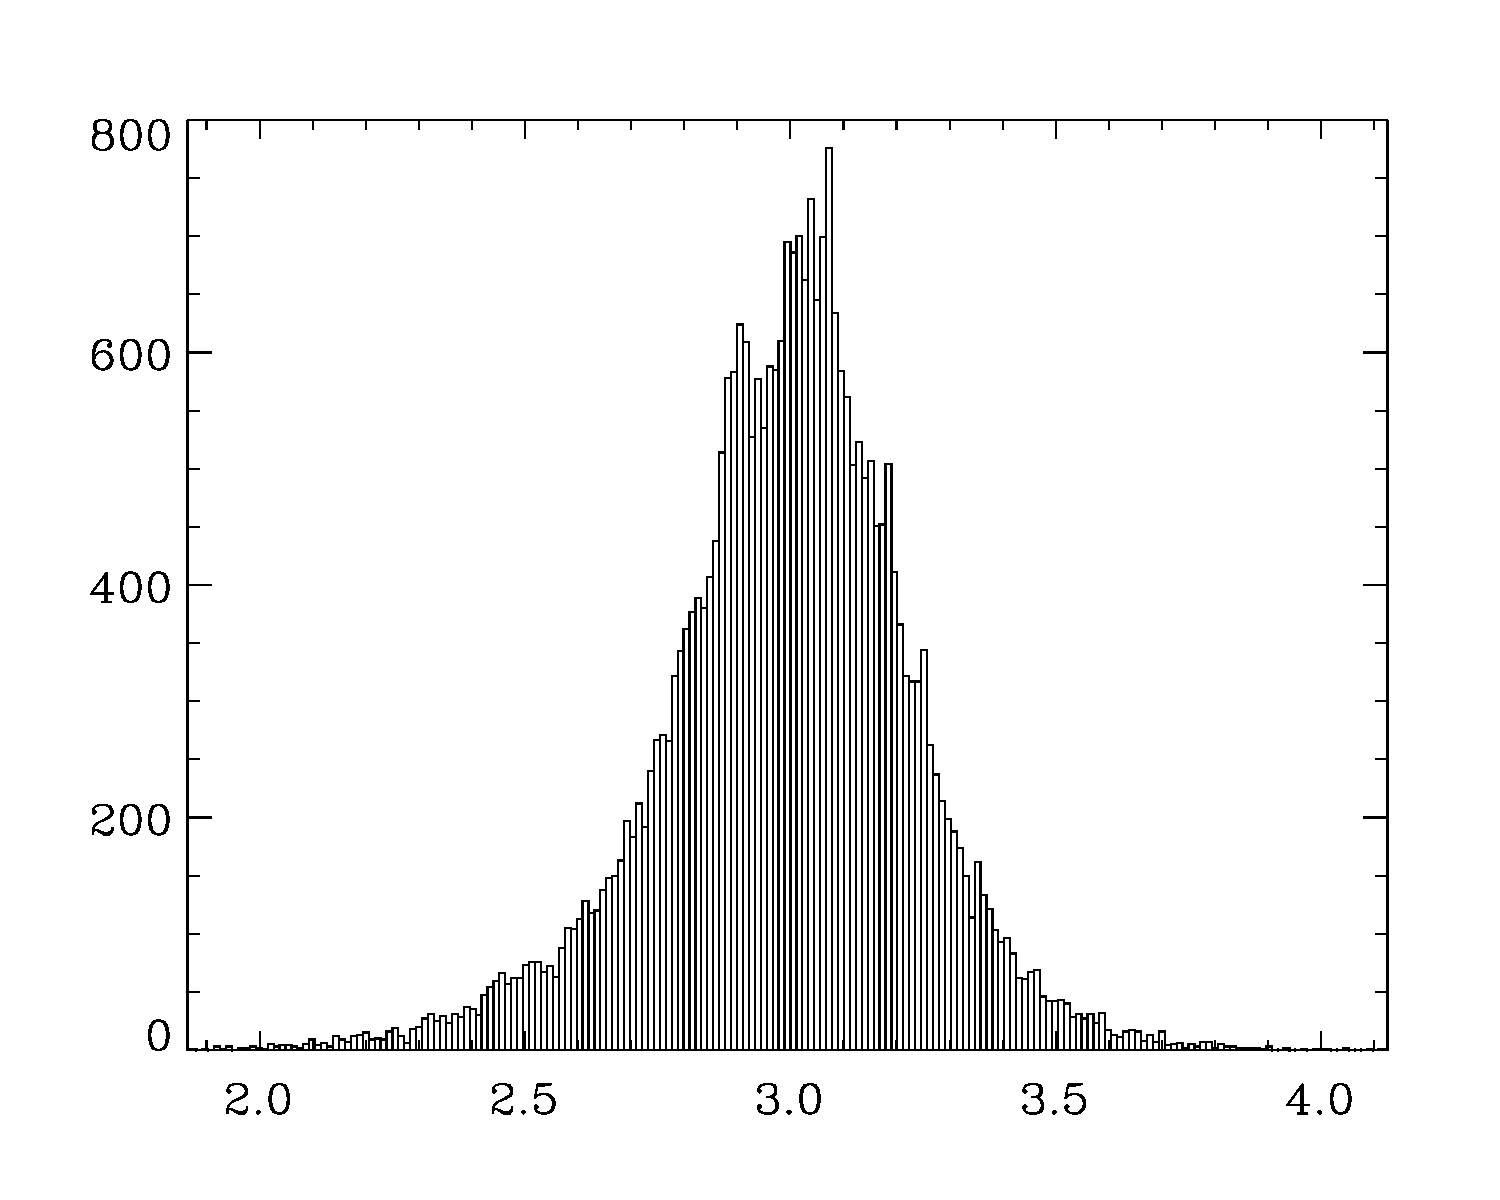
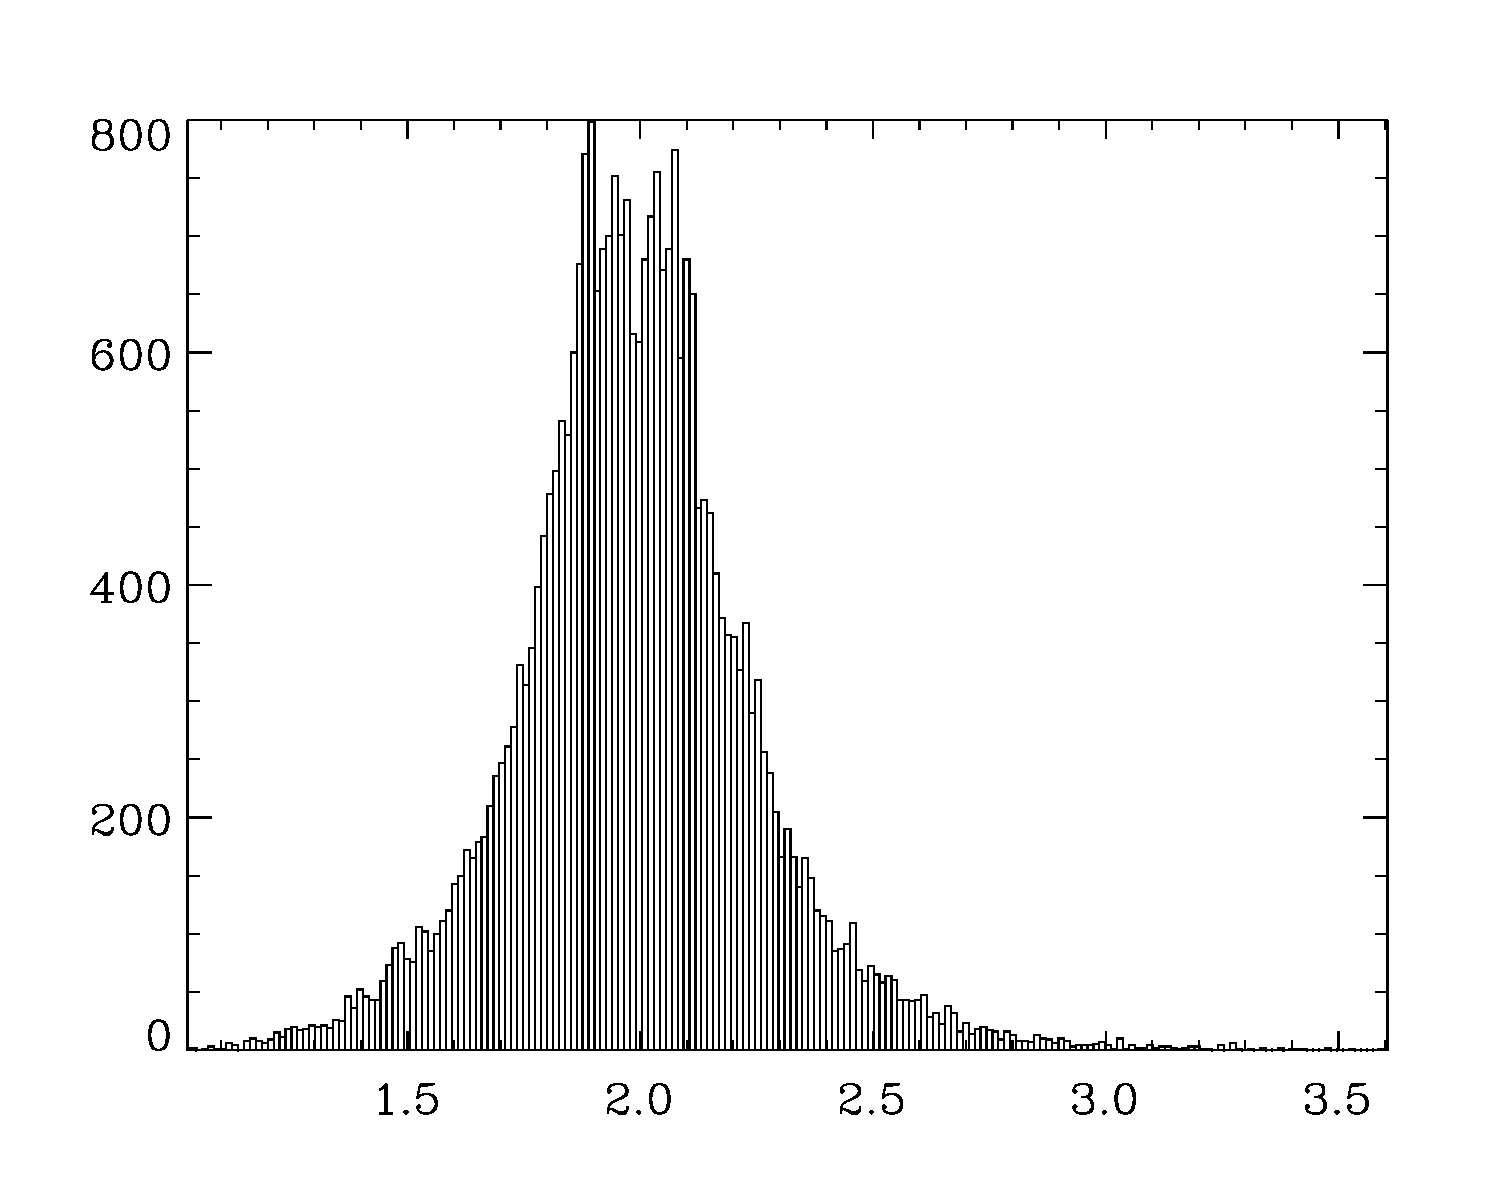
To print the results:
for i=0, output_num-1 do begin
  print, output[i], transpose(output_error[i,*])
endfor
which provide the upper and lower limits on each parameter:
3.00000     -0.35801017      0.35998471
2.00000     -0.37573196      0.36297235
For other standard deviation, you should use different confidence levels:
clevel=0.38292492 ; 0.5-sigma
clevel=0.68268949 ; 1.0-sigma
clevel=0.86638560 ; 1.5-sigma
clevel=0.90       ; 1.645-sigma
clevel=0.95       ; 1.960-sigma
clevel=0.95449974 ; 2.0-sigma
clevel=0.98758067 ; 2.5-sigma
clevel=0.99       ; 2.575-sigma
clevel=0.99730020 ; 3.0-sigma
clevel=0.99953474 ; 3.5-sigma
clevel=0.99993666 ; 4.0-sigma
clevel=0.99999320 ; 4.5-sigma
clevel=0.99999943 ; 5.0-sigma
clevel=0.99999996 ; 5.5-sigma
clevel=0.999999998; 6.0-sigma
Documentation
For more information on how to use the API functions from the idl_emcee libray, please read the API Documentation published on mcfit.github.io/idl_emcee.
Learn More
| Documentation | https://mcfit.github.io/idl_emcee/doc/ |
| Repository | https://github.com/mcfit/idl_emcee |
| Issues & Ideas | https://github.com/mcfit/idl_emcee/issues |
| Archive | 10.5281/zenodo.4495897 |